
Google Maps is great for finding locations and giving directions but it offers a lot more functionality than just that. Google Maps provides the ability to draw lines and shapes directly on the map. In this post, we will discuss how to draw on Google Maps.
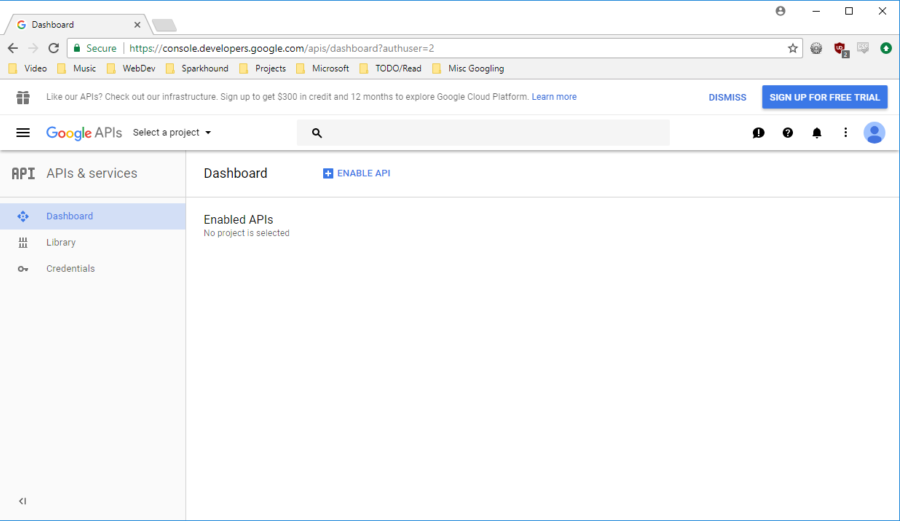
Before we can get started using the API, we need to sign into our google account and register an API key. Login to the developer console and either select an existing project or create a new one if you do not have any created.
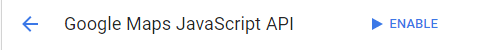
We will need to register the API and generate a key. For this post we will be working with the Javascript API so select the Google Maps Javascript API. After selecting it, we need to enable it.
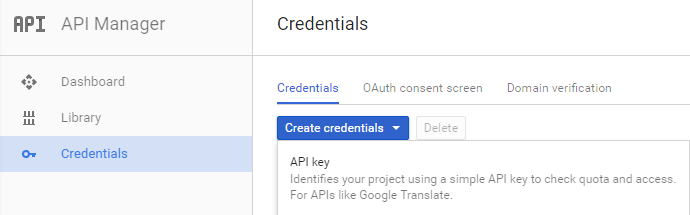
In the left menu, select "Credentials" to go to the key creation screen. Now click the "Create Credentials" drop down and choose "API Key".
Now that we have API access and a key, we can begin interacting with the Maps API! Google has a great set of documentation on their site. Be sure to check it out for the full range of features of the API.
First we need to create a simple HTML page to house the display for our map. In the following code, we create an empty <div /> element to to be our map. Then we add javascript to create a new Google Maps object in that <div>.
<!DOCTYPE html>

<html>

  <head>

    <meta name='viewport' content='initial-scale=1.0, user-scalable=no'>

    <meta charset='utf-8'>

    <style>

      html, body {

        height: 100%;

        margin: 0;

        padding: 0;

      }

      #map {

        height: 100%;

      }

    </style>

  </head>

  <body>

    <div id='map'></div>

    <script>

        function initMap() {

            var map = new google.maps.Map(document.getElementById('map'), {

                zoom: 9,

                center: {

                    lat: 30.4583

                    lng: -91.1403

                }

            });

        }

    </script>

    <script async defer

        src='https://maps.googleapis.com/maps/api/js?key=YOUR_API_KEY&callback=initMap'>

    </script>

  </body>

</html>
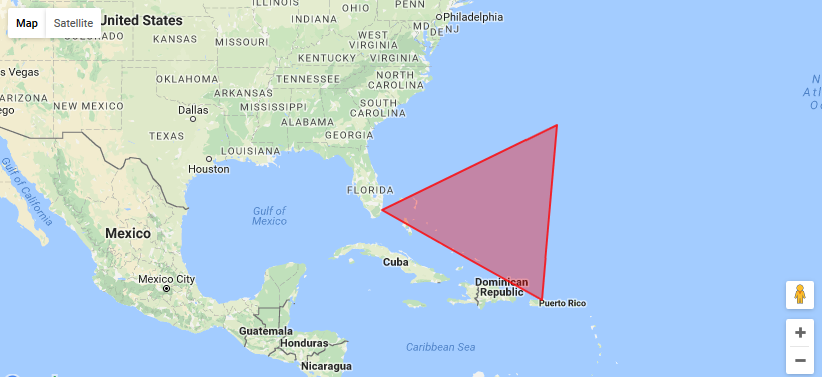
There are several different ways that we can draw on the map. We could create a Polyline object to draw a line or a Polygon object to make some specific shape. Here is a snippet
to draw a triangle on a map (it just so happens to be the Bermuda Triangle). We just add this to the bottom of our
initMap() function.
  var triangleCoords = [

    {lat: 25.774, lng: -80.190},

    {lat: 18.466, lng: -66.118},

    {lat: 32.321, lng: -64.757},

    {lat: 25.774, lng: -80.190}

  ];
												var bermudaTriangle = new google.maps.Polygon({

												paths: triangleCoords,

												strokeColor: '#FF0000',

												strokeOpacity: 0.8,

												strokeWeight: 2,

												fillColor: '#FF0000',

												fillOpacity: 0.35

												});

												bermudaTriangle.setMap(map);
This is good for a single shape but isn't really feasible for drawing lots of complex shapes. What we need is a format capable of handling lots of shapes and metadata about those
shapes. Enter KML (Keyhole Markup Language) is a form of XML that is used to display geographic data. KML has a lot of different elements and options to support many
different scenarios.
<?xml version="1.0" encoding="utf-8"?>

<kml xmlns="http://www.opengis.net/kml/2.2">

 <Document>

    <Placemark>

      <Polygon>

        <outerBoundaryIs>

          <LinearRing>

            <coordinates></coordinates>

          </LinearRing>

        </outerBoundaryIs>

      </Polygon>

      <Style>

        <LineStyle>

          <color>7f001aff</color>

          <width>3</width>

        </LineStyle>

        <PolyStyle>

          <color>7f001aff</color>

        </PolyStyle>

      </Style>

    </Placemark>

  </Document>

</kml>
A Placemark represents an object that we want to draw. A Polygon is the multiline shape. Inside of it are the coordinates that will list all of the latitude and longitude points used to draw it. In this example, an inline Style is being used for the shape's color (PolyStyle) and the color of the outline for it (LineStyle).
Let's look at a real use case - drawing the outline of a zipcode. Since some large and intricate zipcodes can contain lots of data, we will look at a one of the smallest zipcodes in Baton Rouge, 70836. Here is the polygon element of the KML data:
<Polygon>

  <outerBoundaryIs>

    <LinearRing>

      <coordinates>

       -91.090926,30.391668

       -91.090585,30.392085

       -91.090268,30.392418

       -91.090198,30.392493

       -91.090057,30.392598

       -91.089872,30.392713

       -91.089605,30.392844

       -91.089111,30.393008

       -91.088686,30.393129

       -91.088349,30.39321

       -91.088014,30.392494

       -91.088142,30.392461

       -91.088737,30.392229

       -91.089076,30.392025

       -91.089281,30.391854

       -91.089397,30.391754

       -91.089544,30.391599

       -91.089717,30.391367

       -91.089865,30.391145

       -91.090141,30.390614

       -91.090308,30.390414

       -91.090455,30.390287

       -91.090635,30.390154

       -91.09091,30.389905

       -91.091077,30.389717

       -91.091173,30.389579

       -91.091456,30.389142

       -91.091501,30.388986

       -91.091514,30.388848

       -91.091648,30.388865

       -91.092082,30.389137

       -91.092395,30.389279

       -91.092251,30.38951

       -91.092137,30.389657

       -91.091921,30.39001

       -91.091769,30.390287

       -91.091577,30.390591

       -91.091477,30.390732

       -91.091341,30.390969

       -91.091288,30.391054

       -91.091193,30.391209

       -91.091152,30.391303

       -91.090926,30.391668

       </coordinates>

    </LinearRing>

  </outerBoundaryIs>

</Polygon>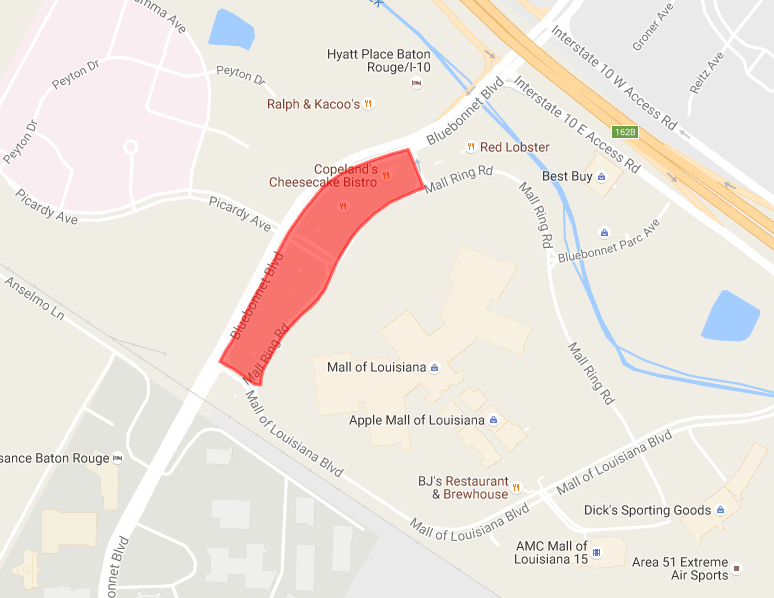
This shows just how much data is required for such a small shape. Zipcodes that follow rivers are the most complex with all of the winding lines that need to be drawn.
Let's look at what's possible if we draw all of the zipcodes in the Lafayette region each with different styles (I switched the map type to satellite to improve visibility for the light colored shapes).
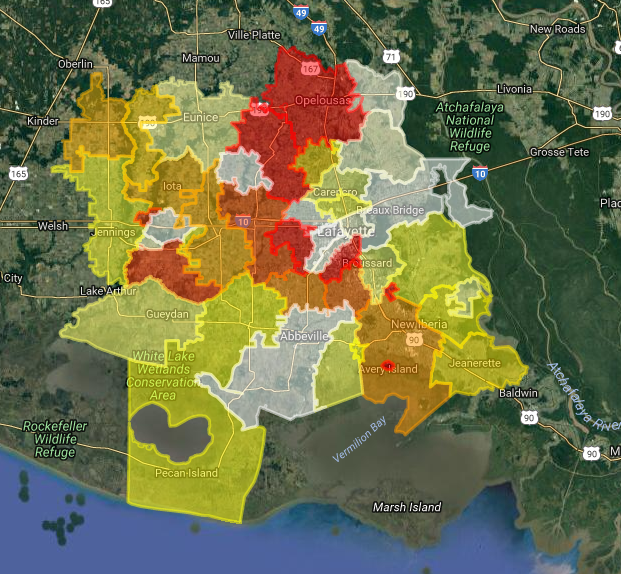
This is really cool when you think about the possibilities of what can be accomplished. Drawing zipcodes was my need, but we could draw cities, states, or even arbitrary shapes or letters - all we need are the points that make up the given shape. A primary source of information for geographical boundary data in the US is the Census website. Depending on your needs, this might not be detailed enough. A good place to find detailed data is searching through Google's Fusion Tables. Fusion Tables are a way to store and share a lot of data, so they are ideal for KML data. Remember that the more detailed the shapes, the bigger the files will be.
This is just the tip of the iceberg of what you can do with the Google Maps API. Hopefully this post sparks some ideas of your own of what you can accomplish with Google Maps. For a full list of features, check out Google's Getting Started Tutorial.
If you want to learn more or are having the same discussions in your own department, Sparkhound is here to help! Get in touch with us so we can discuss how we can help your business achieve its goals through leadership and technology.
Information and material in our blog posts are provided "as is" with no warranties either expressed or implied. Each post is an individual expression of our Sparkies. Should you identify any such content that is harmful, malicious, sensitive or unnecessary, please contact marketing@sparkhound.com
Share this
Google Oauth Integration using an MVC ASP.Net App
.png)
Adding Ads in Xamarin Forms With Custom Renderers
.png)